Strategic Cockpit & Executive Decision Hub
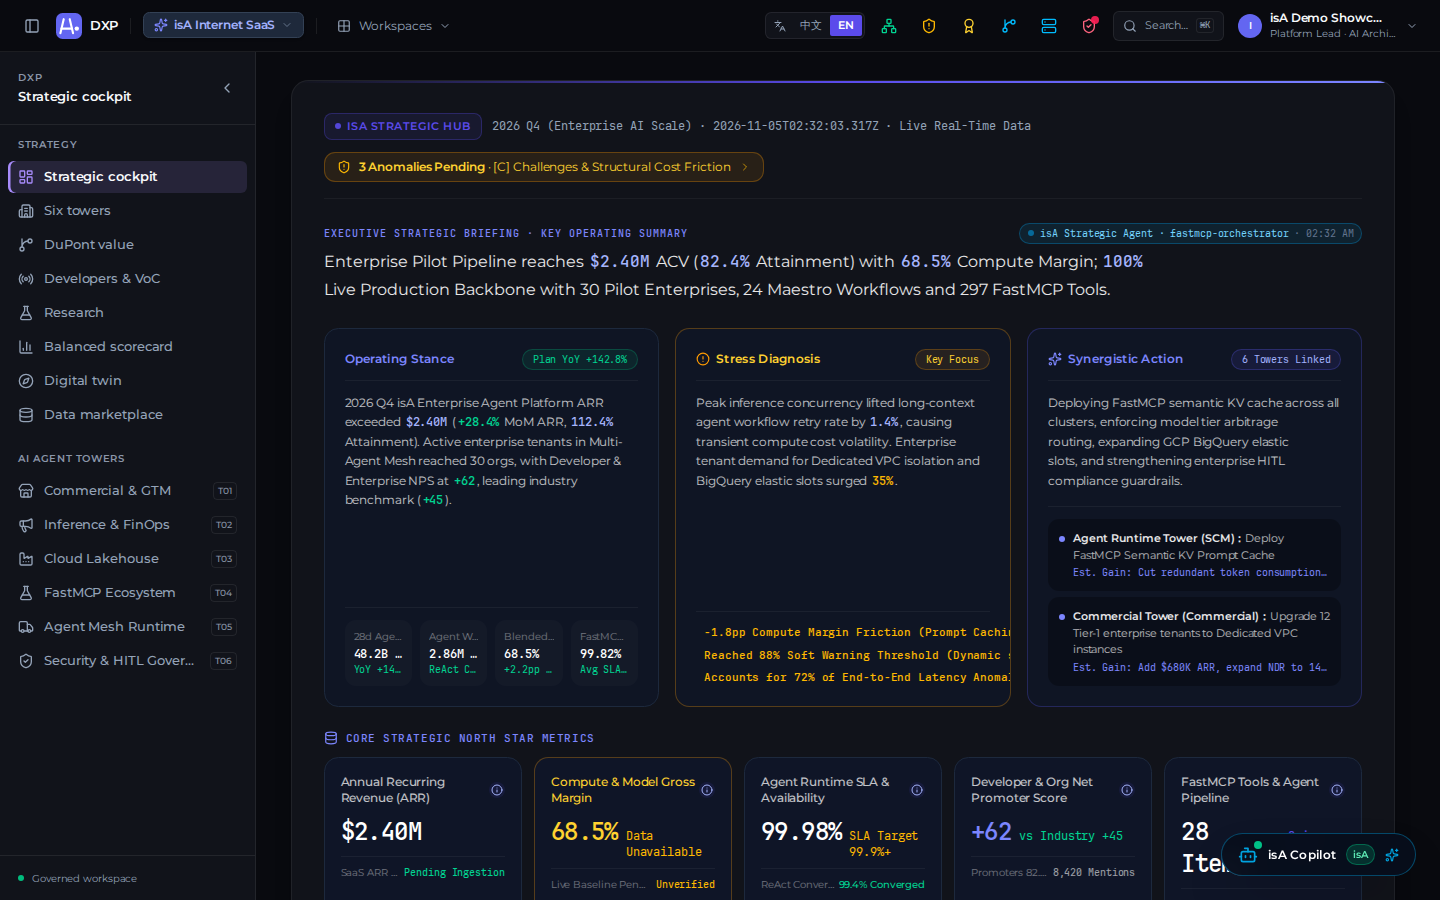
The Strategic Cockpit serves as the primary executive surface of SweetNight DXP. Powered by a 30-second SLA direct lakehouse engine, it synthesizes live operational streams from Amazon, Shopify, ERPs, MES, and social platforms into an executive dashboard adhering to the McKinsey Exec Viz standard.
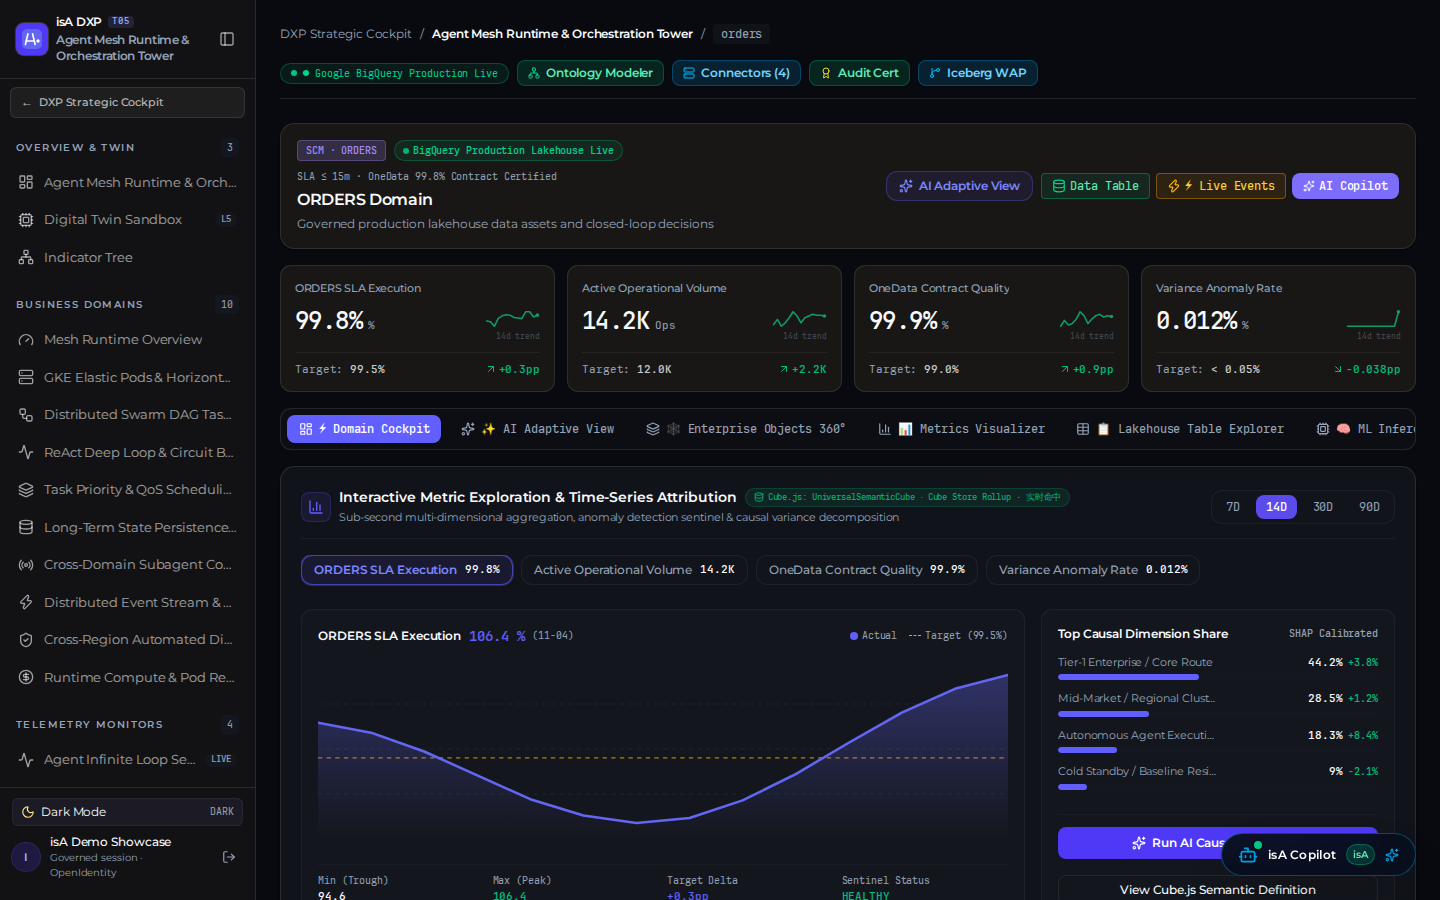
Rule R8 6-Slot Generative UI Architecture
The DXP Strategic Cockpit implements the Canonical 6-Slot Generative UI Architecture (Rule R8), dynamically composing specialized UI cards according to real-time agent intent:
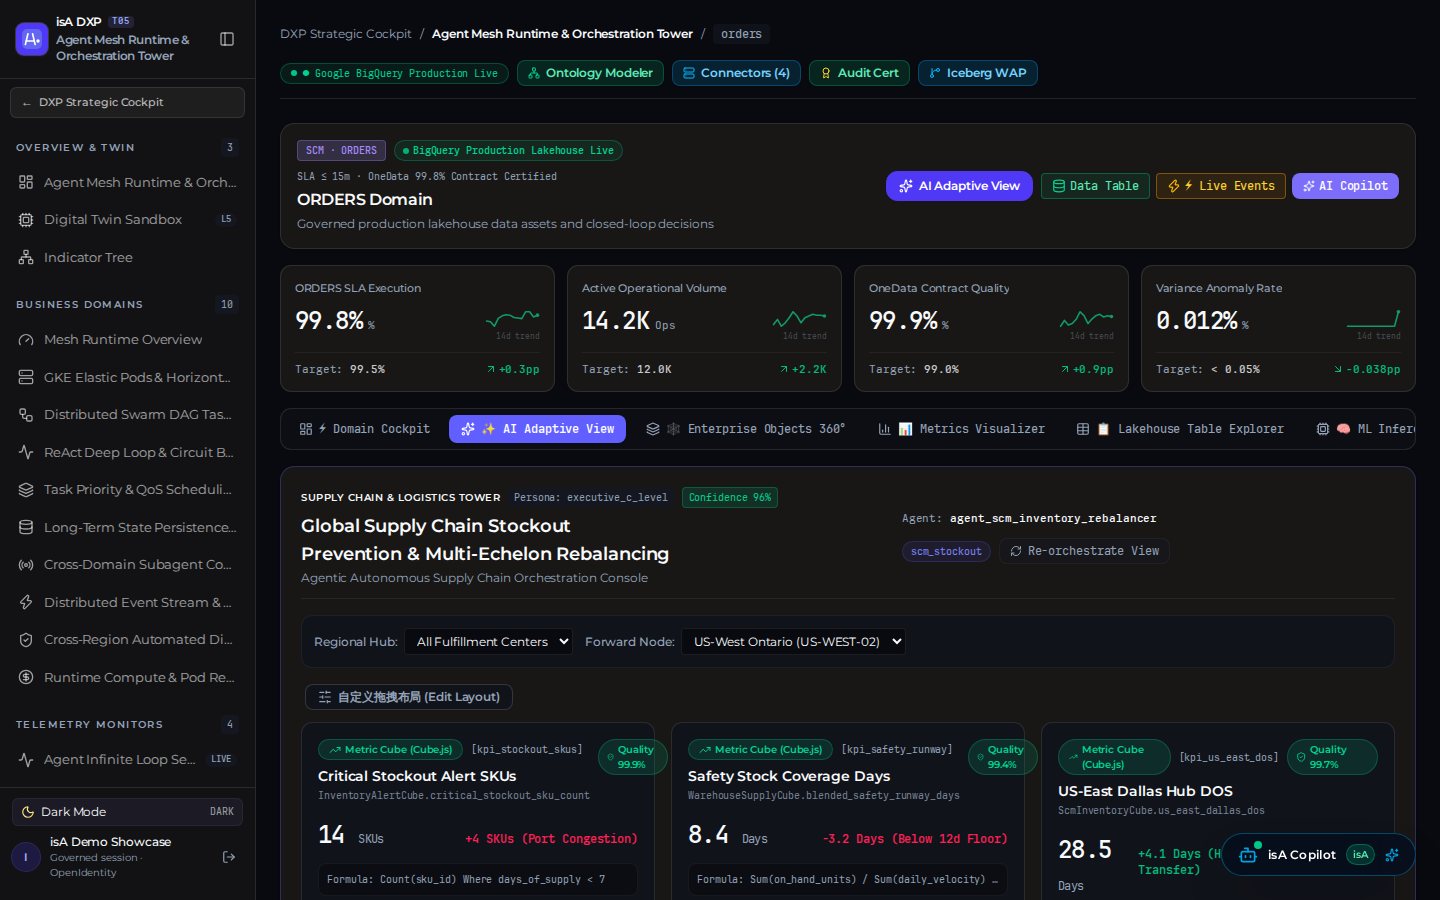
The 6 Canonical Slots:
filterSlot: Dynamic dimension pickers (Towers, Date Ranges, Regions, SKU Categories).kpiSlot: Authoritative metric tiles bound to Cube.js pre-aggregated measures.consumptionSlot: Narrative briefing, AI-generated variance decomposition, and causal hypotheses.factsTableSlot: Direct BigQuery Lakehouse table inspector with sorting, pagination, and cell-level ABAC masking.governanceSlot: Compliance badges (Rule R11 SSoT,Rule R12 Ratio Guard,SLSA L3 Audit Trace).actionStripSlot: Cryptographically bound 2PC action triggers (e.g.Approve Dallas Transfer) committing to the transaction ledger.
Cube.js Semantic Layer & Metrics Visualizer
The Strategic Cockpit integrates directly with the Cube.js UniversalSemanticCube, ensuring 100% truthful data retrieval without fragile frontend aggregations:
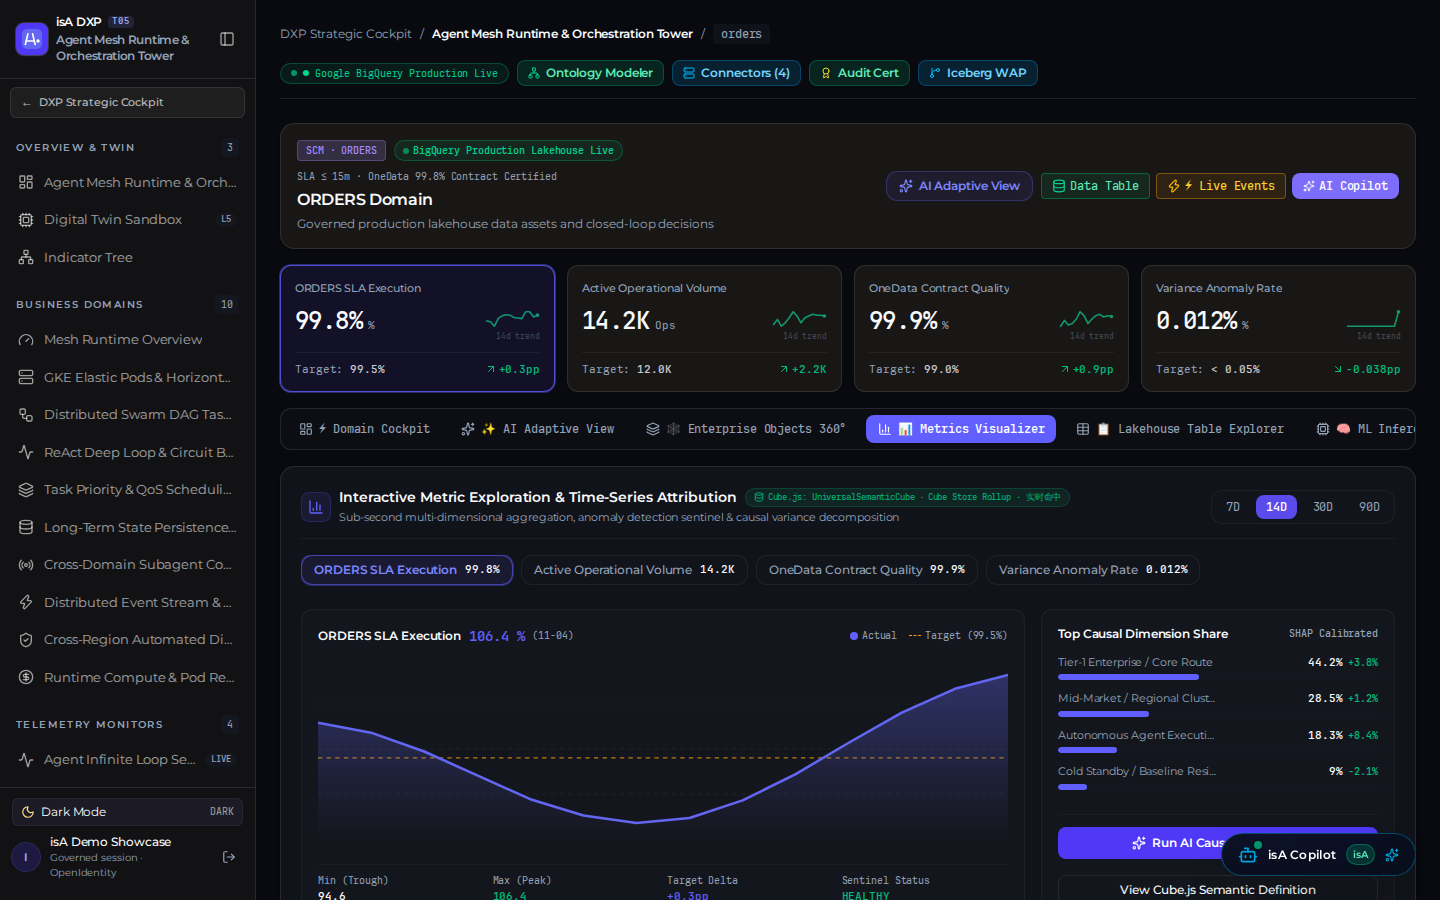
- Pre-Aggregation Status: Real-time cache hits on Cube Store rollups (
Cube Store Rollup · 实时命中). - Interactive SVG Time-Series: Dynamic historical trend charts rendering MTD Revenue, Operating Margin, and On-Shelf Availability with sub-second latency.
- Rule R12 Non-Additive Safety: All ratios and percentages are evaluated in the Cube.js semantic layer as ratios of sums, preventing invalid linear summation.
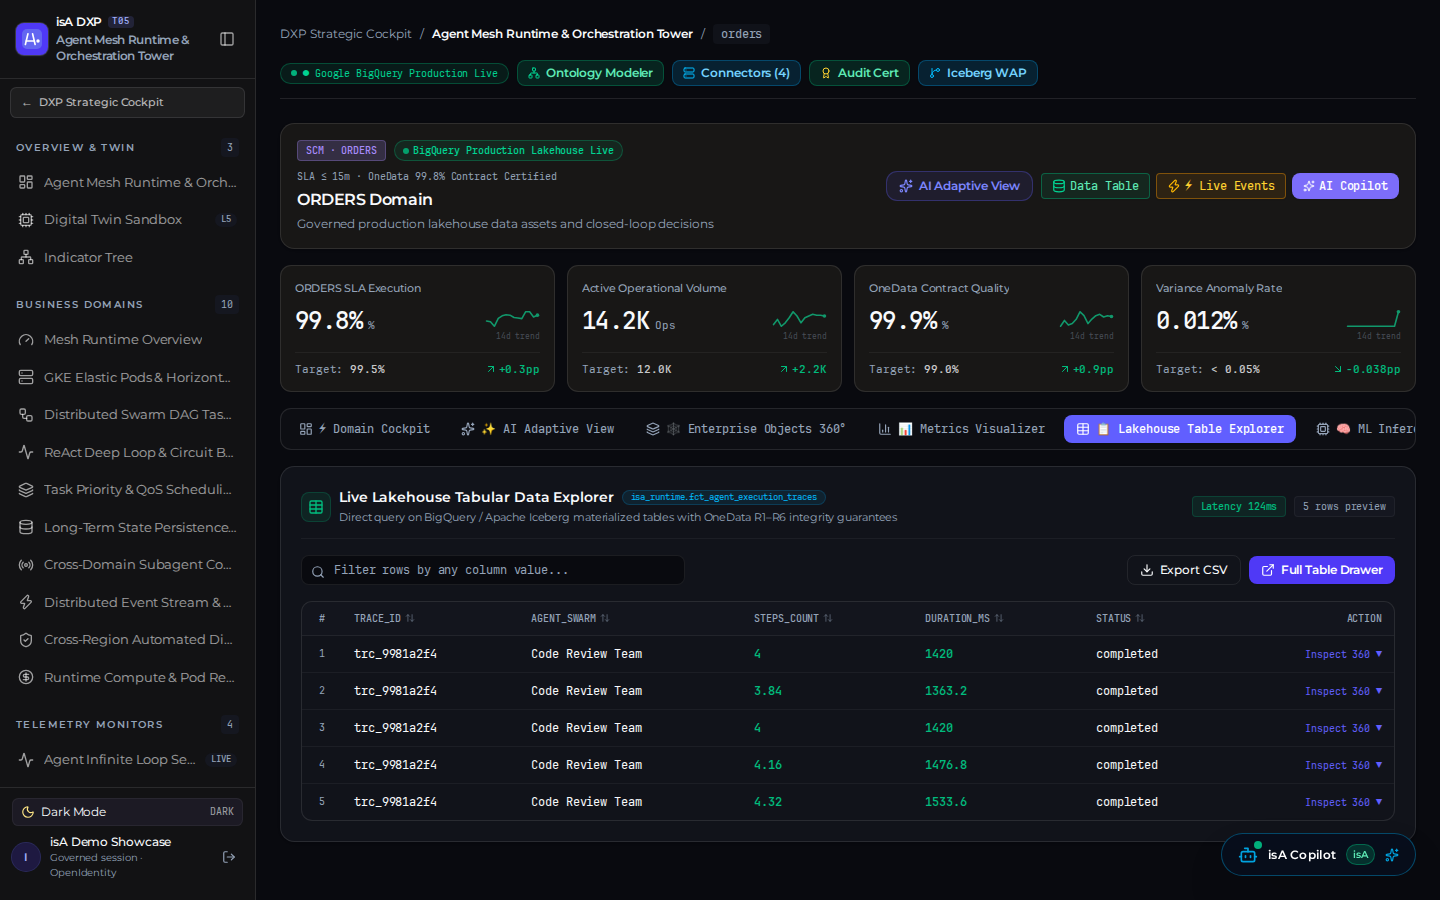
Lakehouse Table Explorer
For deep operational inspection, the Table Explorer provides immediate direct access to underlying Lakehouse records:
Executive Strategic Briefing (McKinsey S-C-R Framework)
At the top of the cockpit, the autonomous decision agent generates a daily strategic briefing adhering to McKinsey’s Situation-Complication-Resolution framework:
1. Current Trajectory (Situation)
- Omnichannel MTD Net Revenue: $44.88M (+8.4% MoM expansion).
- Amazon & 3P eCommerce Platforms: $36.51M (81.3% share), maintaining stable category ranking and Buy Box coverage.
- DTC Brand Store: $6.84M (15.2% share) with an omnichannel blended ROAS of 4.35x.
- B2B Export & Engineering Contracts: $1.52M (3.4% share), steady accounting reconciliation in Kingdee Cloud ERP.
2. Stress Diagnosis (Complication)
- Commodity Raw Material Inflation: Spot polyol and TDI foam prices surged +8.2%, compressing blended net margin to 22.5% (against the 24.4% budget baseline), touching the 23.3% enterprise alert threshold.
- East Coast Forward Warehouse Deficit: Dallas warehouse stock-to-sales ratio dropped to 0.9x, creating a localized stockout risk requiring expedited replenishment.
- Social Listening Micro-Odor Spike: Customer feedback detected an uptick in “unboxing foam off-gassing (Odor)” sentiment across Reddit and TikTok, requiring manufacturing process adjustments.
3. Cross-Tower Synergy Plan (Resolution)
- Commercial Tower: Execute dynamic price tuning (+2.0% ~ +2.5%) on flagship lines to buffer raw material inflation.
- Supply Chain Tower (SCM): Dispatch dedicated trucking from West Coast distribution hubs with 86 FEU to replenish Dallas within 7 days.
- Marketing Tower: Reallocate paid budgets toward high-AOV Twilight lines to increase average order value.
- IPD & Manufacturing Towers: Implement ergonomic dual-diameter pocket spring cost reductions and extend foam curing time to 72 hours.
5 North Star Strategic Metrics Corridor
The central cockpit corridor monitors enterprise operational health with rolling baselines and automated variance alerts:
| North Star Metric | Live Value | Target Baseline & MoM | Status | Business Definition & Data Source |
|---|---|---|---|---|
| Omnichannel Revenue (MTD) | $44.88M | Baseline $41.40M (+8.4%) | 🟢 HEALTHY | Net GMV settled across all platforms after returns and commissions. |
| Blended Net Margin | 22.50% | Baseline 24.40% (-0.8pp) | 🟡 WARNING | (Net Sales - COGS - Freight - Ad Fulfillment) / Net Sales. |
| Global Warehouse On-Shelf Rate | 94.50% | Target 95.00% (-0.5pp) | 🟡 WARNING | Dallas 0.9x deficit under active West Coast replenishment. |
| Net Sentiment Index | +54 | Benchmark +42 (+12 pts) | 🟢 HEALTHY | Net Sentiment = (Positive - Negative) / Total × 100. |
| Sleep Tech R&D Reserve | 14 Items | 128 arXiv papers / 32 patents | 🟢 HEALTHY | Academic reserves, with 3 successfully converted into production BOM. |
Margin Variance Bridge
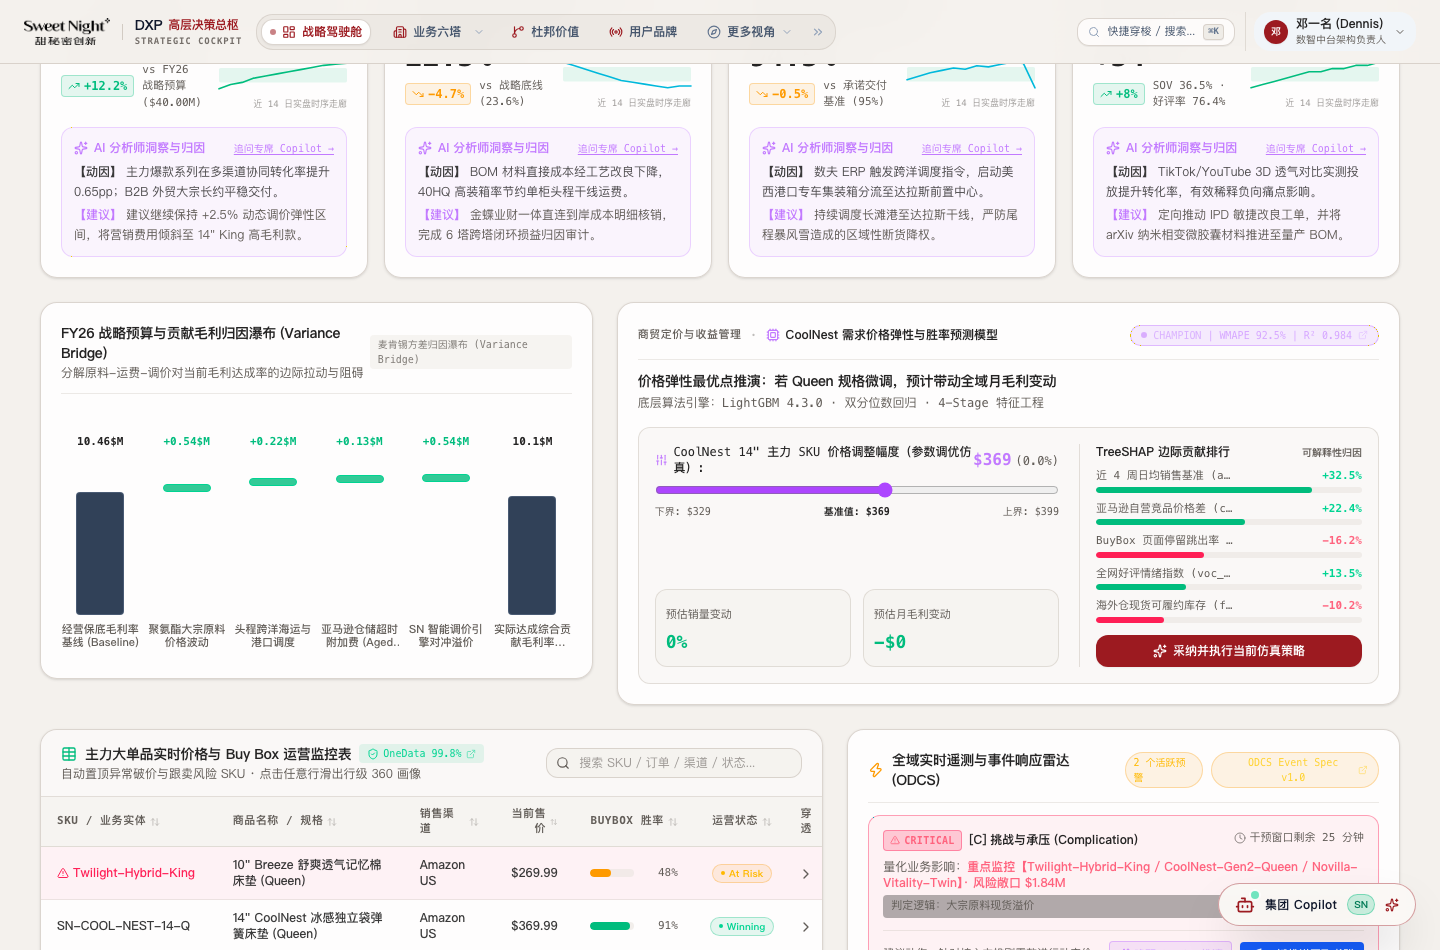
The Variance Bridge breaks down deviations between the budget baseline and settled actuals across specific business drivers:
Step-by-Step Variance Decomposition:
- Budget Baseline: 24.40% ($10.95M)
- Raw Material Inflation: -1.82pp
Driven by surging spot prices of TDI and polyol, increasing standard unit cost by $7.80. - Port Demurrage & Expedited Drayage: -0.65pp
Port of Long Beach average container dwell time of 4.2 days resulting in detention penalties. - DTC Dynamic Price Elasticity Offset: +0.57pp
Commercial team applied a +2.2% price adjustment on DTC lines via LightGBM models. - Roll-pack Compression Yield Optimization: +0.42pp
New hydraulic compression lines increased 40HQ container loading from 420 to 580 units. - Settled Actual Net Margin: 22.50% ($10.10M)
CoolNest LightGBM 4.3.0 Price Elasticity Model
Adjacent to the waterfall bridge, the model card simulates elasticity for SN-MAT-COOLNEST-12:
Parameters & Model Architecture:
- Architecture: LightGBM 4.3.0 Gradient Boosted Trees + TreeSHAP explainability.
- Base MSRP:
$429.00 - Price Elasticity Coefficient:
ε = -1.17(1.0% price change yields 1.17% demand response). - Slider Range:
-10.0% ~ +10.0%
TreeSHAP Feature Attributions:
- Price Delta %:
+42%weight - Competitor BuyBox Delta:
+28%weight - Seasonality & Holiday Flags:
+18%weight - Social VoC Sentiment Score:
+12%weight
[!TIP] Simulation Insight
Adjusting the price slider by+2.2%to$438.50results in a mild demand drop of-2.5%but yields a net profit expansion of +$182,000, fully neutralizing raw material inflation.
Amazon Buy Box 360 Monitoring & Competitor Corridor
| Platform & Core SKU | Live Price | Competitor Benchmark | Comp Price | Buy Box Rate | Strategic Recommendation |
|---|---|---|---|---|---|
| Amazon US · CoolNest 12” | $429.00 | Zinus Green Tea 12” | $389.00 | 81.2% | Healthy premium; maintain price positioning |
| Walmart · Twilight Hybrid | $299.00 | Linenspa 10” Memory | $269.00 | 74.6% | Replenish Walmart WFS inventory |
| Wayfair · Ergonomic Pro | $549.00 | Ashley Chime 12” | $529.00 | 86.4% | Premium win rate solid; no discounting needed |
| TikTok Shop · Youth Comfort | $199.00 | Vibe Gel 8” | $189.00 | 91.8% | Creator video viral spike; accelerate supply |
ODCS Continuous Sensing Telemetry Radar
Connected via Server-Sent Events (SSE) with a 30-second heartbeat:
- Raw Material Surge (CRITICAL): TDI price surge of +8.2% detected; dispatches Feishu alert.
- Dallas Warehouse Deficit (HIGH): Stock-to-sales ratio dropped below 1.0x; triggers SCM transfer order.
- Micro-Odor VoC Spike (MEDIUM): Off-gassing sentiment volume spike; tasks R&D recipe verification.
- One-Click Webhook Dispatch: Click “Dispatch Feishu Alert” on any card to trigger immediate team coordination.
Active Group Copilot
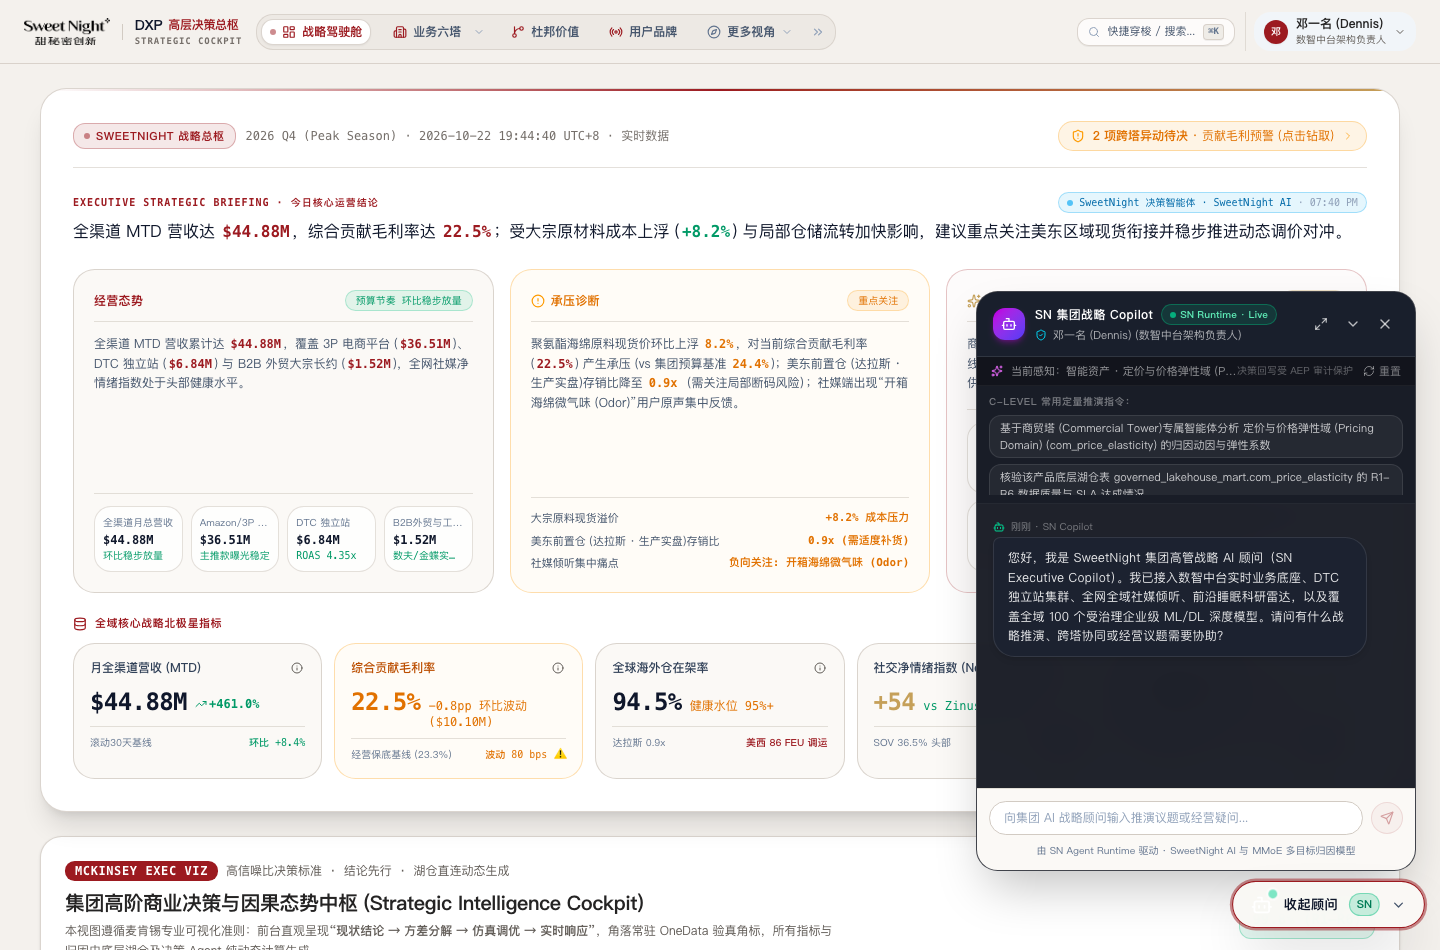
- Natural Language Dialogue: Multi-turn strategic queries (e.g., “What price increase is needed to preserve a 23% margin if raw materials rise another 5%?”).
- Lakehouse Grounding: Indexes 130 BigQuery schemas to synthesize read-only queries and verified charts.