Federated Digital Twin Sandbox & What-If Simulation
The Digital Twin Causal Sandbox is SweetNight DXP’s “flight simulator”. Grounded in Structural Causal Models (SCM) and Bayesian networks, it maps real-world operations across the 1+6 towers into a virtual simulation environment. Executives can simulate black swan scenarios, test extreme cost pressures, and formulate hedging strategies without risking live capital.
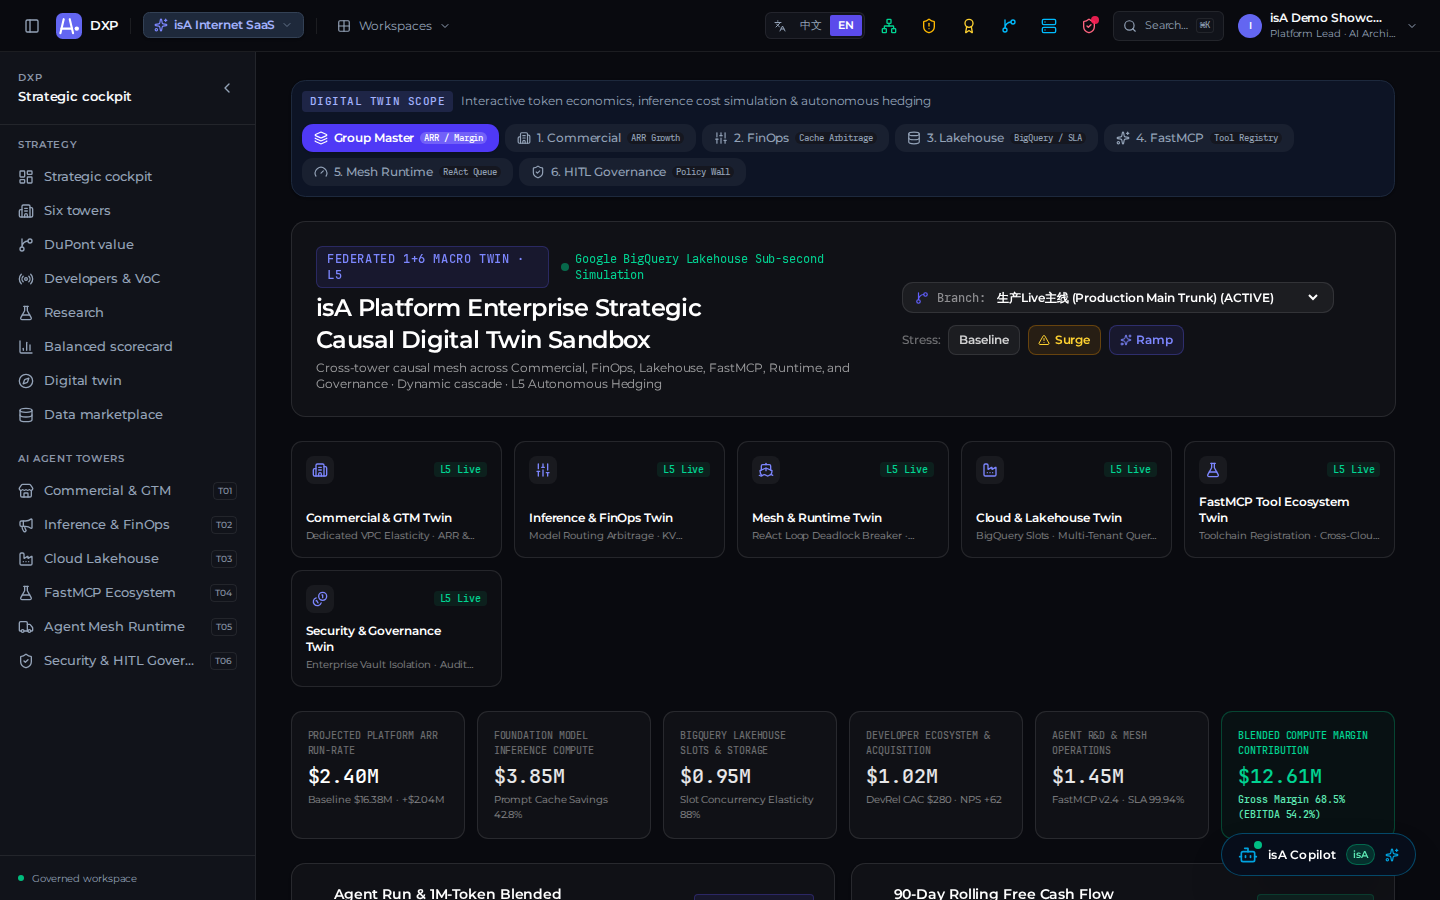
5 Macro Sensitivity Sliders
The sandbox models five exogenous and endogenous drivers affecting cross-border home furnishing operations:
| Sensitivity Slider | Symbol | Range | Live Baseline | Operational Entity & Impact |
|---|---|---|---|---|
| 01 · Commodity Raw Material Inflation | x_1 | -15.0% ~ +25.0% | +8.2% | Drives polyol foam costs, spring steel wire pricing, and standard BOM costs. |
| 02 · Commercial Price Tuning | x_2 | -10.0% ~ +10.0% | +2.2% | Evaluates LightGBM discrete elasticity, predicting demand volume and unit margins. |
| 03 · Ocean Freight per FEU | x_3 | 1,200 ~ 4,500 | 2,850 | Determines 40HQ landed costs, port demurrage, and forward warehouse storage rates. |
| 04 · USD / CNY Exchange Rate | x_4 | 6.80 ~ 7.40 | 7.22 | Influences FX conversion spreads between US dollar revenue and CNY factory procurement. |
| 05 · Paid Ad Blended ROAS | x_5 | 2.50x ~ 6.00x | 4.35x | Affects marginal acquisition costs (CAC) across Shopify DTC and Amazon PPC campaigns. |
Causal Mathematical Equations
ΔRevenue = Base Revenue × (1 + x₂) × (1 + ε · x₂)
ΔCOGS = Base COGS × (1 + 0.65 · x₁) × (x₄ / Base FX)
ΔFreight = FEU Volume × x₃ × (1 - Rollpack Yield Gain)
ΔAd Spend = ΔRevenue / x₅
Projected Net Margin = (ΔRevenue - ΔCOGS - ΔFreight - ΔAd Spend - Opex) / ΔRevenue
Where:
- ε = -1.17 denotes the demand price elasticity predicted by LightGBM.
- 0.65 represents the direct material weight of polyol and steel in total manufacturing costs.
- Rollpack Yield Gain = 0.276 captures the freight dilution achieved by high-tonnage hydraulic packaging.
Bayesian Goal-Seeking Inverse Solver
Traditional BI systems only support forward calculation (“given causes, compute effects”). DXP introduces an Inverse Solver allowing leadership to declare a target outcome and solve for required operational inputs:
Inverse Optimization Scenario:
Target: Sustain a contribution margin of 23.50% despite raw materials at +8.2% and freight at 3,200/FEU.
Clicking “Inverse Solver” activates optimization routines that converge on optimal parameters:
- Commercial Price Tuning (x_2): Raise by +2.8% (volume softens by 3.2%, but revenue expansion covers inflation).
- Paid Ad ROAS (x_5): Target 4.60x on Shopify DTC (retire low-efficiency keywords, prioritize high-intent long-tail).
- Packaging Density: Increase Vietnam factory roll-pack compression by +3.5%, fitting 595 units per 40HQ.
- Result: Settles margin at 23.52%, expanding net cash reserves by 340,000.
3 Pre-Configured Stress-Testing Playbooks
1. Playbook A: Black Swan Supply Shock
- Inputs: Raw materials +20.0%, Ocean freight surges to 4,200/FEU.
- Alert: Without hedging, net margin breaches the 15.0% insolvency red line.
- Hedging: Activate alternative foam supplier certifications and stage tiered price increases.
2. Playbook B: Aggressive Price War
- Inputs: Primary competitor drops price by 15.0%, eroding Buy Box win rate to 62.0%.
- Diagnosis: Price matching causes an 850,000 monthly loss; recommend defending flagship models while introducing secondary value bundles.
3. Playbook C: Currency Appreciation
- Inputs: Exchange rate plunges from 7.22 to 6.85.
- Hedging: Execute forward FX swap hedges and transition supply contracts to RMB billing.